A sizing system is a set of clothing sizes that is created by an apparel firm to fit the range of people in a target market. The most common type of sizing system in the apparel industry starts with a base size which is then proportionally graded (scaled) to create a multiple set of sizes. Sizing systems can use generic labels, such as small, medium, large, and extra large; numbered sizes such as 10, 12, and 14; or body measurements such as 17" neck and 32" sleeve length. Sizing systems vary in range from only a few sizes to a full spectrum of sizes 2-20.
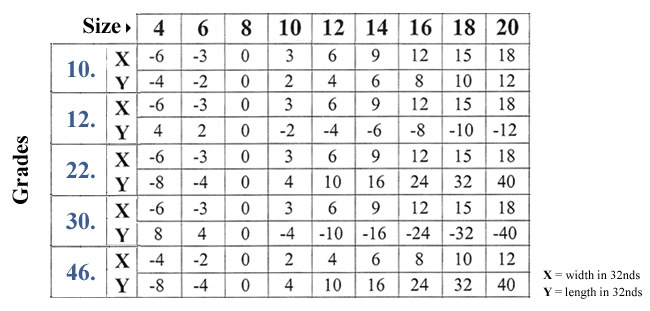
Typically, an apparel company arrives at a sizing system for a product line as follows. First, it defines a target market and typical customers by identifying demographic characteristics, such as age, income, ethnicity, and lifestyle. Then the firm chooses a single person -- the "fit model" -- to be the idealized body shape for that product and market. Prototype garments are created, then evaluated and modified in fitting sessions on the single fit model. A base size pattern, often size 8 for women, is perfected for this prototype garment, and proportional grade rules are used to scale a set of patterns up and down for the rest of the size range, e.g., 2-16.
Proportional grade rules do not address the differences in the basic shapes and body proportions of the population, such as small or large waist, short or long torso, or the differences across ages and target markets. A single fit model has a particular body shape that is translated to the full range of sizes. Providing good fit using a finite set of sizes for an almost infinite range of body types is a challenging task. The new information available from the 3D body scan research will help us meet this challenge.